SFR inventory is growing, as it does at the start of the year.
Unofficially, it's now higher than at any point MBC has previously recorded in 22 months of public market tracking. But let's stick to the data we've got from our twice-monthly updates.
On Jan. 15, we had SFR inventory west of Sepulveda of 115, just 9 shy…
SFR inventory is growing, as it does at the start of the year.
Unofficially, it's now higher than at any point MBC has previously recorded in 22 months of public market tracking. But let's stick to the data we've got from our twice-monthly updates.
On Jan. 15, we had SFR inventory west of Sepulveda of
115, just 9 shy of the highest figure yet from one of MBC's updates (Oct. 15, 2008).
Now let's take a look at how inventory grew in 2008, and where.
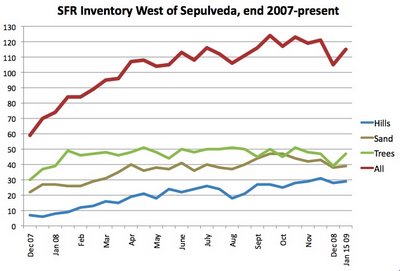
As this graph shows
(click to enlarge), the biggest culprit in burgeoning inventory is the Hill Section. Inventory there has grown from a trifling
6 as of 1/15/08 to
29 a year later.
Throughout much of 2007, we saw inventory in the Hills averaging 12-15 SFRs, so the steady growth in inventory last Spring and Summer has really changed things.
The Hill Section is a much smaller pocket of MB, so the fact that inventory there is now nearing the levels of other areas is noteworthy. (Before you ask, no, we don't have precise breakdowns of the number of homes in each section of MB west of Hwy. 1.)
The Sand Section had a little Spring surge last year, building up to
40 by the end of April, and peaked again in Fall at
47.
By contrast, you could almost say the Tree Section has behaved. After the standard early-year re-build-up of inventory, the Trees were pretty flat, lingering near
50 offerings at a time until a dropoff near the end of 2008.
Looking at our whole subject region west of Sepulveda, inventory began 2009 substantially higher than it began 2008 –
105 this year vs.
59 last year. (See the "
MB Market Update for 12/31/08.")
Comparing points a little closer to the current moment, inventory of
115 in mid-Jan. 2009 is a jump over
70 in mid-Jan. 2008. (For a more indepth analysis with graphs comparing 2007 and 2008, please see "
Inventory Higher This Year" from Dec. 2008.)
The graph clearly shows that inventory rose throughout the first 4 months of last year before beginning to level off. There's no telling where we'll see the numbers go this year, but we certainly seem to have only just begun.
Please see our blog disclaimer.
Listings presented above are supplied via the MLS and are brokered by a variety of agents and firms, not Dave Fratello or Edge Real Estate Agency, unless so stated with the listing. Images and links to properties above lead to a full MLS display of information, including home details, lot size, all photos, and listing broker and agent information and contact information.
Based on information from California Regional Multiple Listing Service, Inc. as of July 22nd, 2024 at 4:25pm PDT. This information is for your personal, non-commercial use and may not be used for any purpose other than to identify prospective properties you may be interested in purchasing. Display of MLS data is usually deemed reliable but is NOT guaranteed accurate by the MLS. Buyers are responsible for verifying the accuracy of all information and should investigate the data themselves or retain appropriate professionals. Information from sources other than the Listing Agent may have been included in the MLS data. Unless otherwise specified in writing, Broker/Agent has not and will not verify any information obtained from other sources. The Broker/Agent providing the information contained herein may or may not have been the Listing and/or Selling Agent.


