Sure, inventory remains tight, but there are hopeful signs, like 13 new listings in this past week. This is the way Spring should look.
So we're hoping to put The Great Impossible Market of 2022 in the rear-view mirror.
Before we do, though, there's another angle to look at the current, tight market, and…
Sure, inventory remains tight, but there are hopeful signs, like 13 new listings in this past week. This is the way Spring should look.
So we're hoping to put The Great Impossible Market of 2022 in the rear-view mirror.
Before we do, though, there's another angle to look at the current, tight market, and that's in terms of Months of Supply.
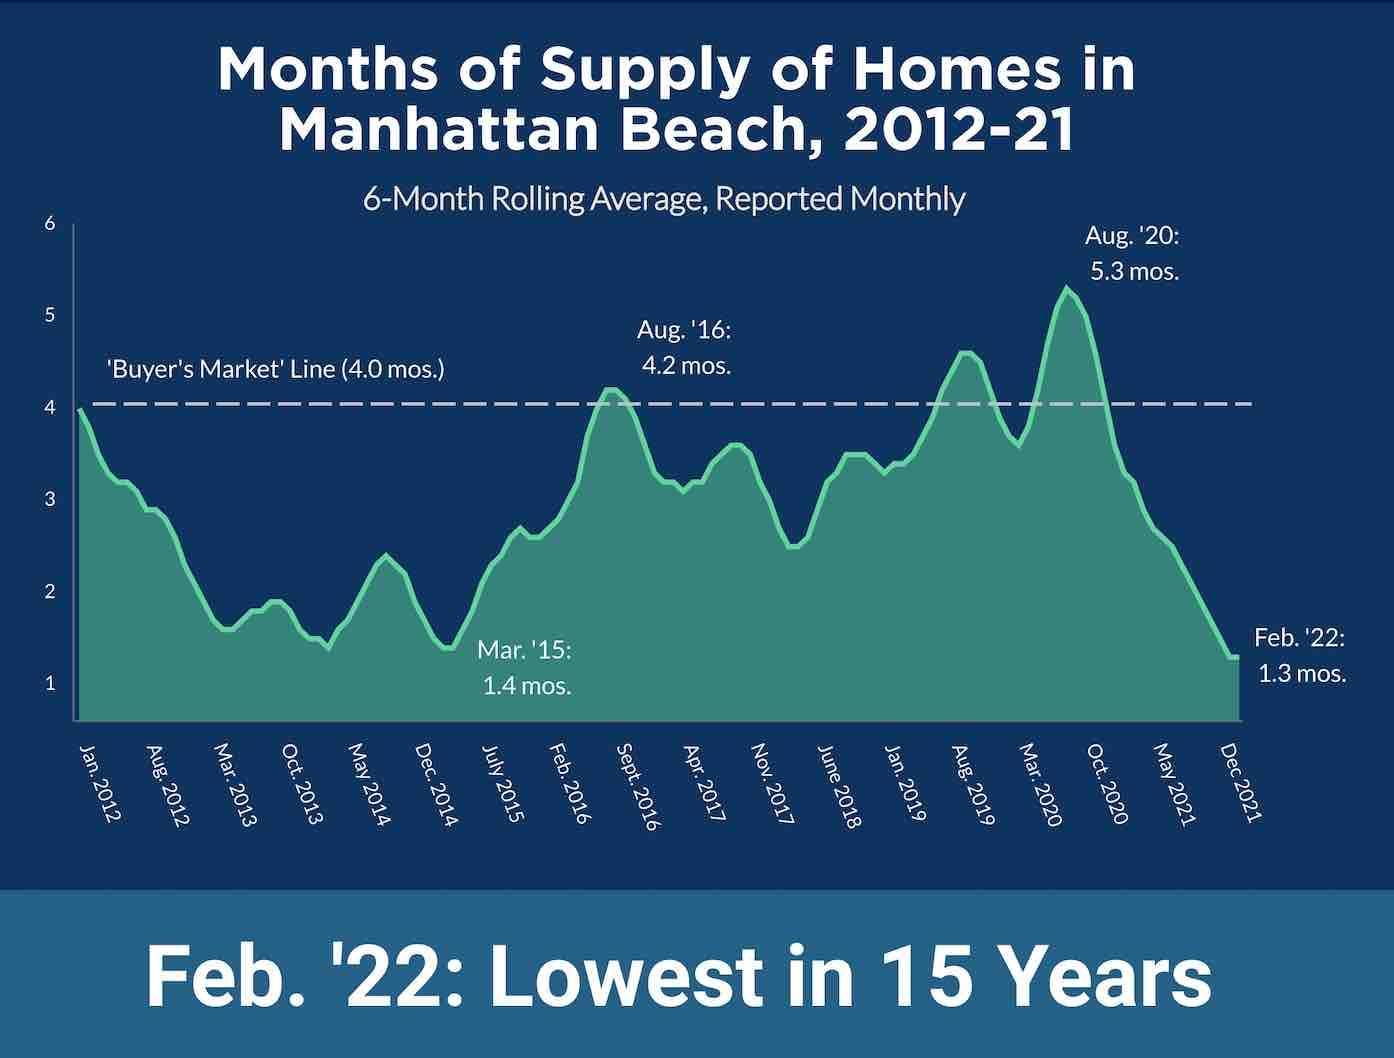 The measure takes into account the pace and number of homes going into escrow, and estimates how long it would take to sell everything on the market.
And whaddaya know?
Feb. 2022 was rock bottom, with just 1.3 months needed to (hypothetically) sell off everything.
It's been 7 years since Months of Supply was so low (March 2015), at 1.4 months, but Feb. 2022 is actually the lowest figure recorded over 15 years.
Can we take one more look at a part of that graph?
 Yeah, this part, with the crazy downhill slope.
(Do NOT ski this.)
Not only did we just wrap up a month with the lowest-ever Months of Supply in 15 years...
It came after 18 straight months of steep declines, dropping from a peak of 5.3 months in August 2020. That's a decline of 75%.
The only period sort of like this on the chart is glimpsed in 2012 through early 2013. That trend actually dates back a bit further than the data shown on the chart. The decline began with an Aug. 2011 peak of 5.1 months of supply, and came down to April 2013's 1.6 months. That was a 20-month slide of 69%, meaning this most recent slide was faster and deeper.
Months of Supply is mostly just a market indicator. It's not going to help you sell your house or buy a house. It's a measure of the environment, and can be correlated with price trends.
There's a broad consensus that in today's world, a Months of Supply figure of 4.0 months or higher represents a "buyer's market" environment, where buyers have leverage because they have options. Prices tend to be flat or declining in those environments.
Here at MBC, we called attention to the rising Months of Supply figure a few times (in real time) during 2019. That year concluded with a decline in the Manhattan Beach median home price of 2.0%.
We also noted the downtrend in this figure during 2021, as it was sliding into the 2's. As you know, prices have been increasing markedly as months of supply has dipped.
We're going to add a little color on this damnable inventory situation.
With inventory so tight that we're at a 15-year historic low for months of supply, that still suggests, doesn't it, that there is something on the market for buyers?
We recognized a flaw in that assumption. It has to do with price point.
Throughout a given year, there will always be some higher-priced inventory that, by nature, will tend to hang around a while. There are fewer buyers up there, and they are pickier.
 We decided to chart all inventory with a marker for homes priced $5M and higher. This is a way to look at the portion of inventory that consists of the least-affordable, highest-priced elite properties.
As of Feb. 28, precisely half of total inventory (28) was priced at $5M or higher.
That includes 3 out of 4 Hill Section listings and 10 out of 17 Sand Section listings, for instance.
You can see how unusual it is for half the inventory to be so high-priced by looking at a few other points on our chart. We picked out 3 other times that $5M+ inventory was at 14:
- In March 2020, total inventory was at 80; $5M+ inventory was 17.5% of all listings
- In April 2021, total inventory was at 83; $5M+ inventory was 16.8% of all listings
- In Sept. 2021, total inventory was at 54; $5M+ inventory was 26% of all listings
Even when the $5M+ inventory hit a high point of 30 listings in Aug. 2020, that was only 24% of all listings.
What this means, in the end, is that the squeeze has been a little tighter than it first appears for buyers with a budget lower than $5M.
The situation can only get better as Spring unfurls.
Please see our blog disclaimer.
Listings presented above are supplied via the MLS and are brokered by a variety of agents and firms, not Dave Fratello or Edge Real Estate Agency, unless so stated with the listing. Images and links to properties above lead to a full MLS display of information, including home details, lot size, all photos, and listing broker and agent information and contact information.


