Manhattan Beach may be just 4 square miles, but that's plenty of room for diversity in real estate.
Right now, as the city begins a recovery in home sales activity, some regions of town are performing better than others. (For more data on the recovery, see: "Mild Bounceback in First Half Sales - Manhattan Beach Market Update for 6/30/24.")
East Manhattan is doing least-worst among areas of MB, when we compare first-half sales east of Sepulveda with the average number of sales over 17 years.
Indeed, data seem to show East Manhattan being the most consistent producer in town, regardless of trends in other areas, almost never getting too high or too low compared to the trend for all of Manhattan Beach.
Check out our latest chart:
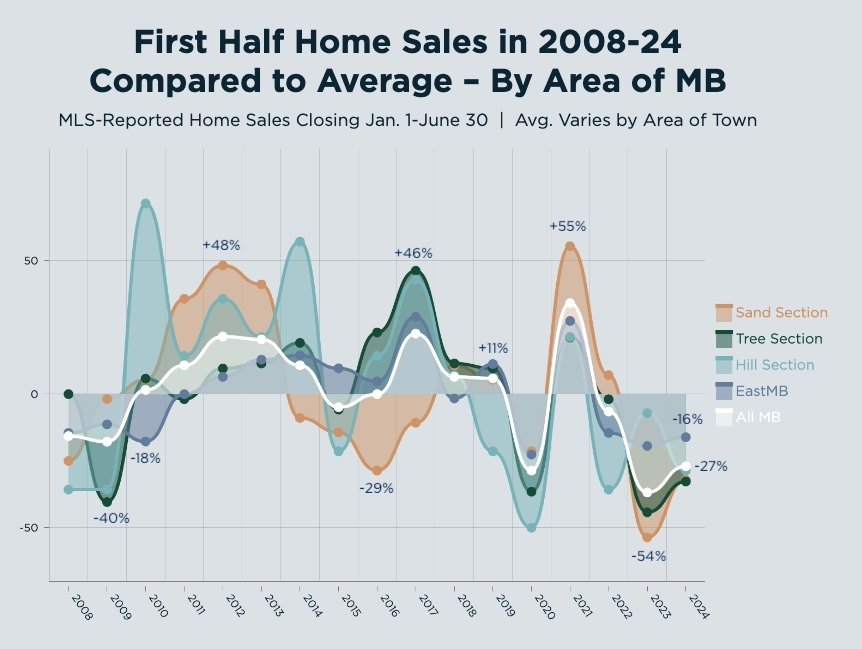
Each point on the chart, plus or minus, reflects annual sales totals for Jan. 1-June 30 for a given area of Manhattan Beach, versus the average for that area across years 2008-2024.
The white line across the chart is the trend line for the whole city, while individual areas of town have their own colored lines.
By comparing any one colored line to the white (city) line, you can readily see certain areas over-performing or under-performing the city's average sales pace, with bursts of extra activity, or dropoffs in activity.
Some of the most dramatic fluctuations belong to the Sand Section, which always has a big chunk of the city's annual sales, and the Hill Section, which has fairly few sales each year. (Hill Section data are more volatile for that reason.)
The orange-colored line for the Sand Section peaks at 48% above its average as part of a developing "hot" market in 2011-13, and again at +55% in hot-hot-hot 2021. But the Sand line sags well below the rest of the market from 2014-17, and in 2023 bottoms at -54% – the near-inverse of that very recent 2021 peak.
Compare any other area's trend line to East Manhattan's blue line, and you see how the area seems much less prone to wild shifts.
And jump to the end of the chart. Here, you'll see East Manhattan's blue line showing -16% for 2024, meaning that region is off of its average sales pace by 16%.
Meantime, the city as a whole is down 27% from average. The Tree Section and Sand Section rest further below that, at -32%, each twice as bad off as the east side.
Indeed, East Manhattan hasn't dipped as deeply as the city average in either of the last two years.
The region also out-performed city totals from 2014-17 and 2019-20.
Only one time did old-stalwart East Manhattan drastically under-perform the city as a whole: Back in 2010, while the city was right at its average, and East MB was -18%.
A look at the Tree Section's green line shows an area that's mostly quite close to the citywide trends for above/below average, with only a couple of big anomalies: One was 2017, when the Trees saw 46% more sales than is typical for the area, part of a 2016-19 period when the region outperformed the city as a whole.
The other anomaly was way-back-when in 2009, as the Tree Section fell 40% below its typical pace, more than twice as far below normal as the city as a whole.
Lower Sand Section Sales in '23 Impacted City Median Price
Looking at that big drop in last year's first half for the Sand Section (-54%), we were reminded about another data deep-dive that we did late in 2023.
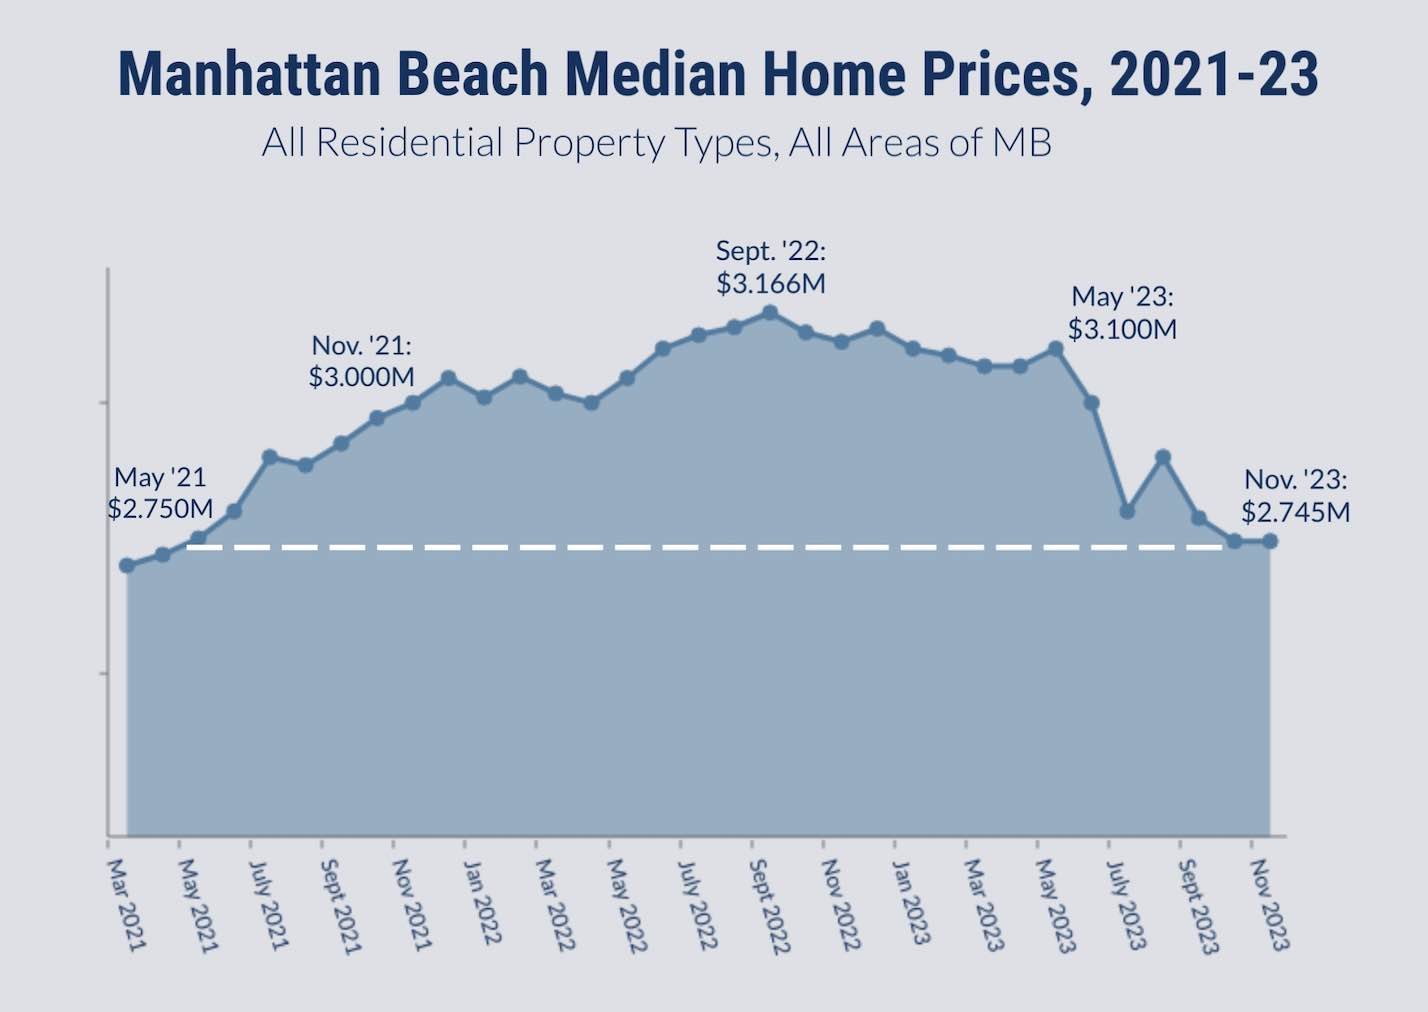 Noting back then that the Manhattan Beach median home price had dropped 12% in 12 months (through the end of November '23), we found that among the sales to that point, there were "many fewer condos/townhomes, and properties priced between $3M-$6M... It seems that some 'missing' Sand Section townhome sales could explain what looks like a market-wide drop."
In other words, the drop in sales in the Sand Section seemed to be a main reason why the city's overall median price fell.
There's no one clear reason as to why there were so many fewer sales by the beach last year: Low inventory, prices or lack of buyer demand all could have played a part. We just observed that with fewer beach (town)houses trading, the city as a whole took a hit.
Of course, the market as a whole benefited in 2021 from the +55% surge in Sand Section sales, with the median price rising 17% in a single year.
So count on East Manhattan to keep churning along with a fairly regular level of sales, but maybe watch the Sand Section if you want to see where prices are going.
Please see our blog disclaimer.
Listings presented above are supplied via the MLS and are brokered by a variety of agents and firms, not Dave Fratello or Edge Real Estate Agency, unless so stated with the listing. Images and links to properties above lead to a full MLS display of information, including home details, lot size, all photos, and listing broker and agent information and contact information.

