The end of Summer brings return to school, return to business, return to more regular activity in the real estate market. (And, this year, return of our annual charity softball tournament in town, but that's another story.)
So on occasion of this market update, we'll recap in one place where things stand as we…
The end of Summer brings return to school, return to business, return to more regular activity in the real estate market. (And, this year, return of our annual charity softball tournament in town, but that's another story.)
So on occasion of this market update, we'll recap in one place where things stand as we enter the typically busier September/October period.
If you were monitoring MB Confidential over the Summer (well, we know you were), you caught different threads of this data as it emerged in fits and starts.
Months of Supply Is Down
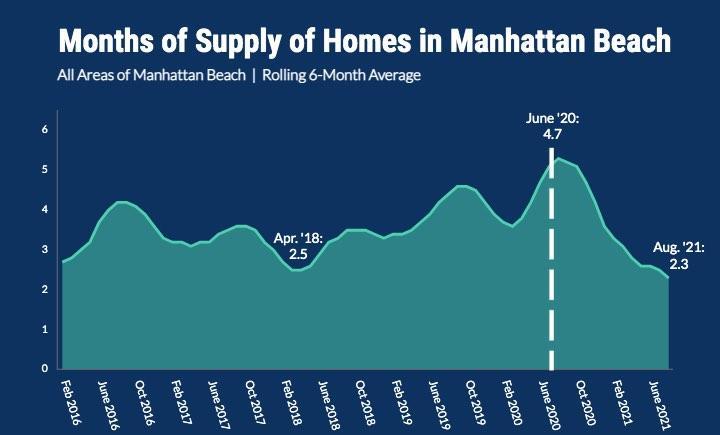 A combination of low inventory and high demand has brought one market measure, Months of Supply, to its lowest level in 6 years.
With just 2.3 months of supply in this market, we finished August 2021 at exactly the same level as Aug. 2015. (We are using a 6-month rolling average here; the monthly figure for August alone was 1.9 months.)
This measure purports to answer: How many months would it take, hypothetically, to sell all the inventory that's out there on the market?
When it grows and reaches 4-6 months, the market is slowing, and there's a threat that the market may swing in buyers' favor.
We called attention to this measure in Fall 2019, as the winds in the market seemed to be blowing a bit against sellers. (See "Months of Supply Peaks Again," Sept. 2019.) It was up to 4.2 months then.
On our new chart here, you can see that late-2019 bump in the chart before a seasonal dip in early 2020, followed by a steep Summertime peak in 2020 at 4.7 months.
It's no surprise, as you read this, why this supply/demand metric peaked last Summer - the market had shut down for a stretch and took time to recover.
That recovery over a full year now looks like a kids' slide, almost straight down.
Summertime Sales Hit a Recent High
 While last year's post-lockdown real estate market shot like a rocket, 2021 saw more closed sales in June-August than any of 5 prior years.
That's 156 sales in this specific 3-month period (June 1-Aug. 31), reflecting purchase activity mainly from around May through early August.
It's even more of a feat when you consider the perennially low inventory.
That must mean homes are selling quickly.
Oh, hey, there's another measure for that.
Historically Low DOM to Sell
 There is a good way to check how long homes sit on the market.
You crunch the numbers from the MLS for publicly listed properties.
Throw out the ones that don't sell. Focus on the ones that are listed and find a buyer.
What's typical?
Oh, you'll see all kinds of numbers from all kinds of markets, and a clear seasonal rise in typical DOM.
We're looking at the median DOM here for properties that do sell. So, half took more days, half took fewer days to sell.
Look back 5 years, and take a look at that... 48 DOM was the median to sell in Sept. 2016.
And for Aug. 2021? Just 9 DOM.
We're giving you all the data way back to the "bad old days," like chunks of 2008-2012, to show you how drastically, historically low 9 DOM is for a median time to sell.
Wow.
It's enough to make you say WTAF, which as you know means, "What's That Actual Figure?"
Did Someone Say Low Inventory?
 So, a bunch of sales, low DOM, low months of supply... obviously, low inventory is a part of that equation. Even homes that do come out don't sit around long enough to be counted.
We were pretty shocked at inventory in mid-August, when it was at 62, less than half the prior year.
At the end of August, inventory was at 50, a figure you just don't see in the past 5 years.
(You can find 50 and below in 2013-15.)
One could argue that late-Summer inventory should wane, because the received wisdom here is to try to avoid a Summer listing if you can. Wait till the end of the month or the busier September-October period.
But 50. C'mon. 50 listings.
It can only go up from there, right?
Here's the rest of our local real estate market update report for the period ending 8/31/21:
> 50 active listings as of 8/31/21 (-12 from 8/15/21)
> 31 SFRs (-13)
> 19 THs (-2)
See the Inventory list as of 8/31/21 here, or see the MB Dashboard for up-to-the-minute data.
Active listings by region of Manhattan Beach in this report:
> Tree Section: 14 actives (-1)
> Sand Section: 27 actives (-7)
> Hill Section: 5 actives
> East MB: 4 (-7)
We're also providing a report on closed sales by region of MB
Sales data, including PPSF for all properties, are organized by sub-region of Manhattan Beach.
Here's a link to the spreadsheet: "MB Pending/Sold as of 8/31/21".
Please see our blog disclaimer.
Listings presented above are supplied via the MLS and are brokered by a variety of agents and firms, not Dave Fratello or Edge Real Estate Agency, unless so stated with the listing. Images and links to properties above lead to a full MLS display of information, including home details, lot size, all photos, and listing broker and agent information and contact information.


