One year ago, we had to report something a bit grim.
Home sales in the first half of the year 2023 had "crashed."
No year out of the prior 15 years had seen fewer home sales close in Manhattan Beach, not even the real estate depression years of 2008-09. (If you'd like to revisit that post, see: "First Half Sales Crash - Manhattan Beach Market Update for 6/30/23.")
This year, the picture is just a bit better.
More interestingly, perhaps, Manhattan Beach and the South Bay are outperforming several other markets.
It feels like we're poised to see validation of a truism that's been observed in several previous real estate cycles: Luxury markets like Manhattan Beach tend to be the first to recover. (The second part of that is that our market tends to bounce back bigger than others as a full recovery unfolds.)
For this report, we'll focus almost entirely on sales totals, in perspective. Prices will be in a future post.
Closed Sales Tick Up
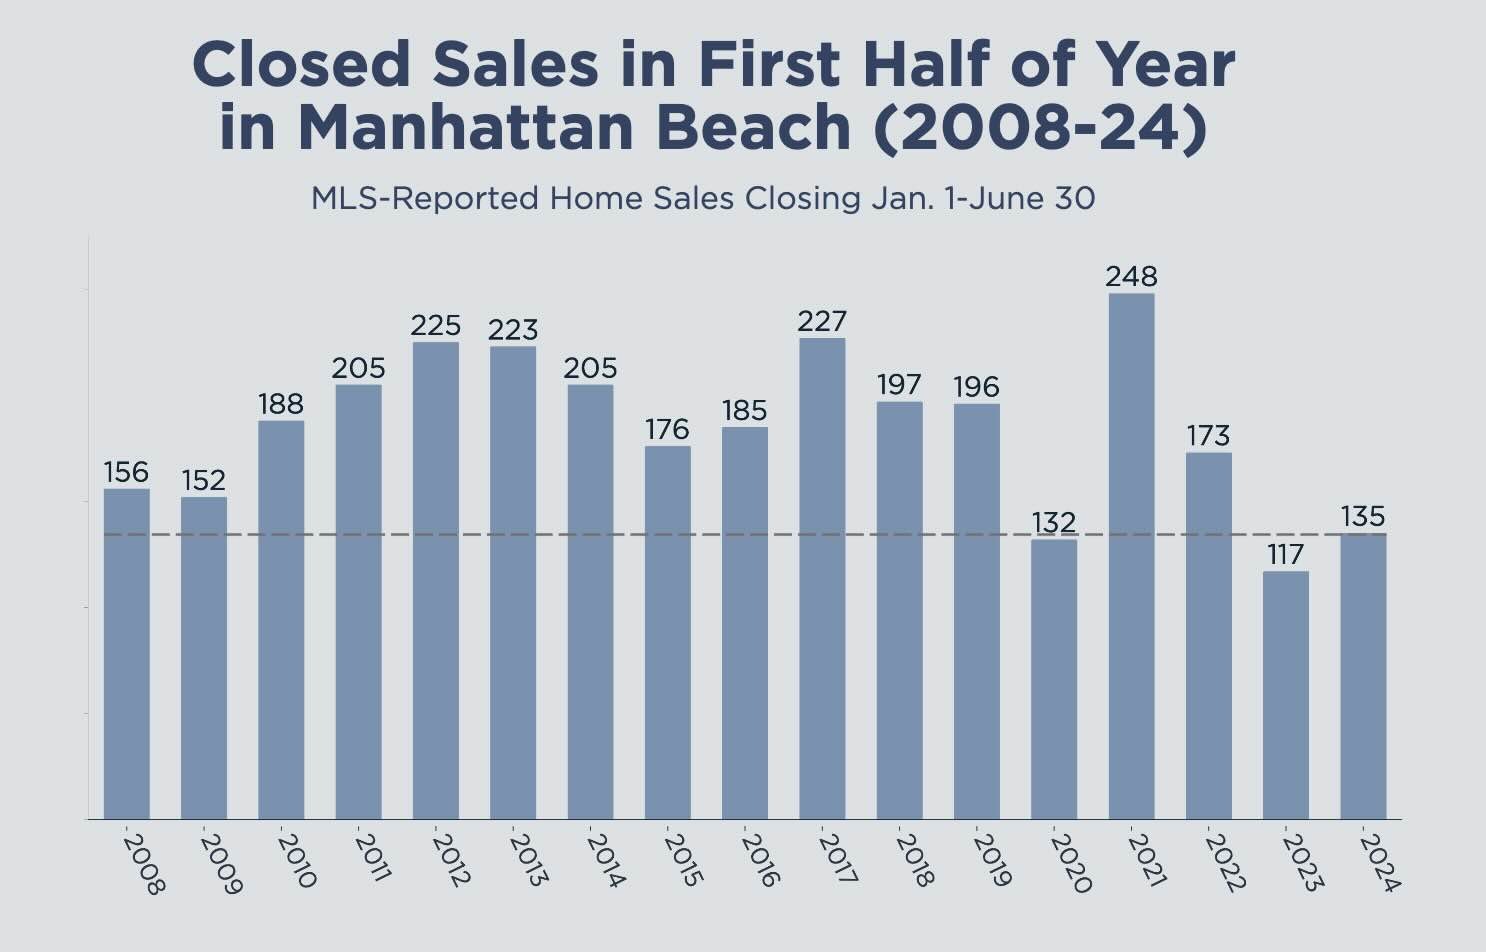
In an average full year, Manhattan Beach sees something like 400 home sales.
In the first half, the average is 185 closed sales.
This year, we saw 135 closed sales, well off the pace. However, it's a 15% improvement over last year's 117 closings. Take a look at the past 17 years in our chart.
Are you a "glass is half empty" or "glass is half full" type?
The 135 closings here in the first half of 2024 is the third-worst of 17 years on the chart.
But it's also third-best out of the past 5 years. How's that glass lookin'?
If you go back all the way to the beginning of the chart, yes, you'll see that we're still lagging those depression years.
How are you supposed to feel when you hear there's less interest in buying & selling homes today than there was during a global financial crisis?
At a time of very low unemployment, very high stock market valuations, booming consumer spending, and wage growth outpacing inflation, we are not in a global financial crisis.
What's holding back real estate today is pretty much the same thing holding the market back last year: Interest rate changes. Fewer owners are willing to sell, giving up their ultra-low mortgage rates, and fewer buyers are willing to buy, finding current rates less attractive. (Every time we tell our story about literally dancing in celebration of a 6.5% mortgage rate oh-so-many years ago, we kinda feel like grampa trying to tell "the kids today" how easy they have it.)
Comparing First Half Sales Pace
Let's put this year's stats in perspective.
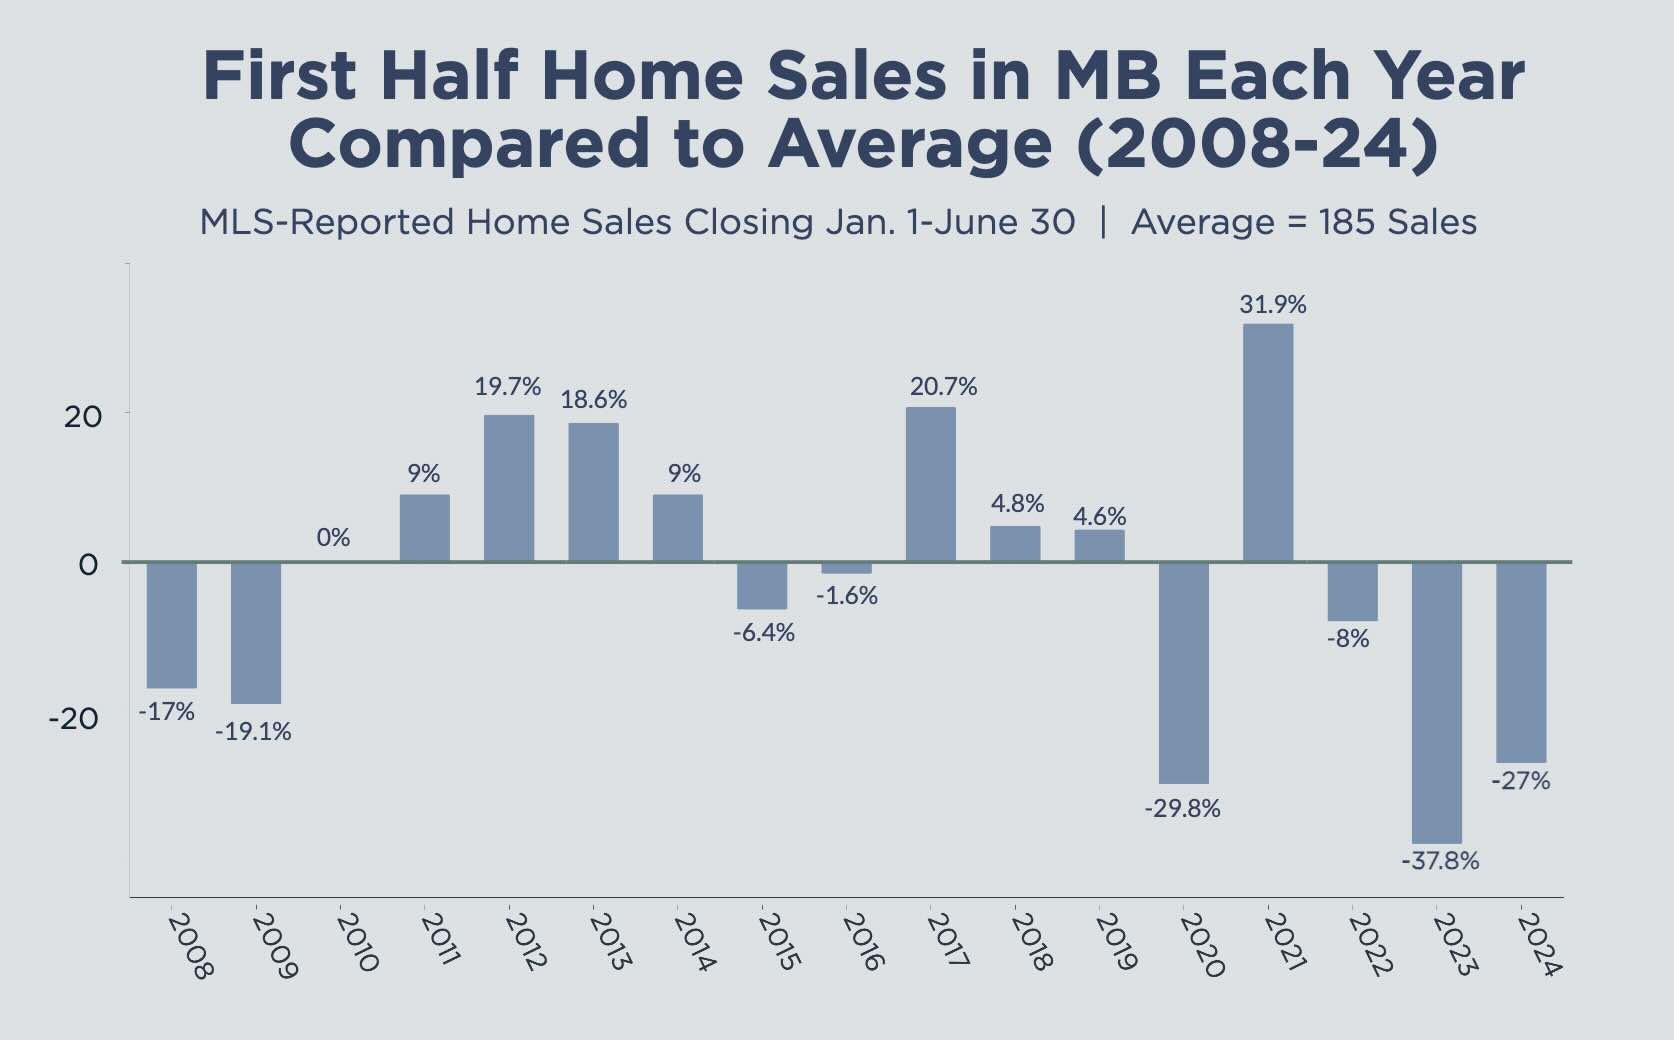
We've already shown you total sales in absolute terms. This chart shows each year's data in relative terms.
The average number of homes sold Jan. 1-June 30 across all of the past 17 years, 2008-24, is 185 total.
Only one year literally had that many sales – 2010 – while the rest, obviously, were either above or below average.
Those deep depression years of 2008-09 were down 17-19%. The first half of covid's debut in 2020 saw far fewer sales, 29.8% below average.
Go-go 2021 saw a monster pace of 31.8% above average, with 248 sales in this period.
2022 slipped 8% below average, and then came 2023, fully 37.8% below pace.
This year's -27%, then, is an improvement, year-over-year – if still sluggish.
It looks like the first step toward recovery.
How Manhattan Beach & South Bay Compare
When we broaden our lens, the picture changes somewhat.

Last year, we could not quickly find a region or city that was worse off than Manhattan Beach in how far below average our sales pace was.
This year, MB and the South Bay are performing better than 4 SoCal counties, including L.A. County. (To be fair, L.A. County overall is minus 27.5%, while we're down 27.0%, so you could almost call those equal.) Last year, MB lagged L.A. County by 10%.
Only the O.C. did better than MB in the first half, and that's pretty close, at 26.2% below average.
You gotta give it up for the South Bay, at only 18.9% below average – that's a strong recovery already. (South Bay was down 27.3% last year.) We're seeing the heaviest action now in Torrance and Redondo.
So yeah, things are tough all over, if you want to measure by how many homes are selling. (We do know that the average person is unaffected either way.)
But we're certainly not repeating 2023's woeful totals, and things look better ahead.
------------------------------------------------------
Here's the rest of our local real estate market update report for the period ending 6/30/24:
> 92 active listings as of 6/30/24 (+6 from 6/15/24)
> 66 SFRs (flat)
> 26 THs (+6)
See the Inventory list as of 6/30/24 here, or see the MB Dashboard for up-to-the-minute data.
Active listings by region of Manhattan Beach in this report:
> Tree Section: 18 actives (+1)
> Sand Section: 45 actives (+6)
> Hill Section: 9 actives (flat)
> East MB: 20 actives (+1)
We're also providing a report on closed sales by region of MB.
Sales data, including PPSF for all properties, are organized by sub-region of Manhattan Beach.
Here's a link to the spreadsheet: "MB Pending/Sold as of 6/30/24".

