We think of Summer as a sleepy time of year in the local real estate market – although there are often some deals to be had, for those who are out hunting.
Here in 2024, we have detected what seems like an above-average pace of new listings emerging throughout the Summer months, continuing up till now, as the kids have returned to school.
That rollout of new listings has left us with a markedly improved level of inventory. Dare we call it "normal," after a few years of steeply sub-normal inventory?
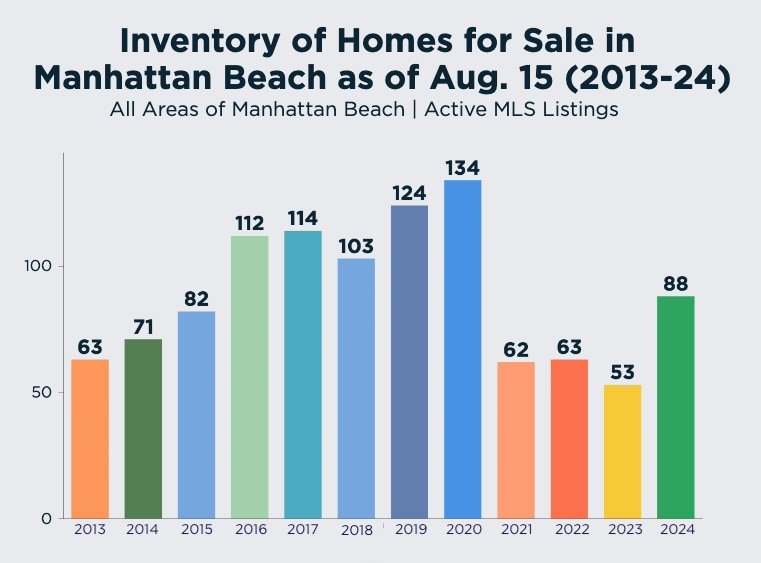
Last year at this time, we referred to inventory levels (53 listings) as "crimped." That seemed fair, as it was notably lower than inventory at the same time in all of the previous 10 years.
Now, with 88 listings as of Aug. 15, 2024, we had inventory 66% higher than last year.
That's higher than 6 of the prior 11 years, but about 30% below the levels from a recent span, 2016-2020.
It's more "normal" than not, and that seems welcome. Complaining about "low inventory" was getting really, really boring.
Before we move on to our next chart, we're going to share two quick front-line observations:
1) Mortgage rates have come to right around 6.0% for many conventional loans, a rate that would be considered low over almost all periods of recent history – except in the immediate wake of the covid pandemic's ultra-low rates. And there could be rate cuts coming.
2) Based on sales activity at several levels, in Manhattan Beach and across the South Bay, it feels like the market has begun to "unlock." This is more vibe than data so far, but several agents have shared the same opinion with us.
Time for our next chart, which does not yet reflect our #2 observation above.
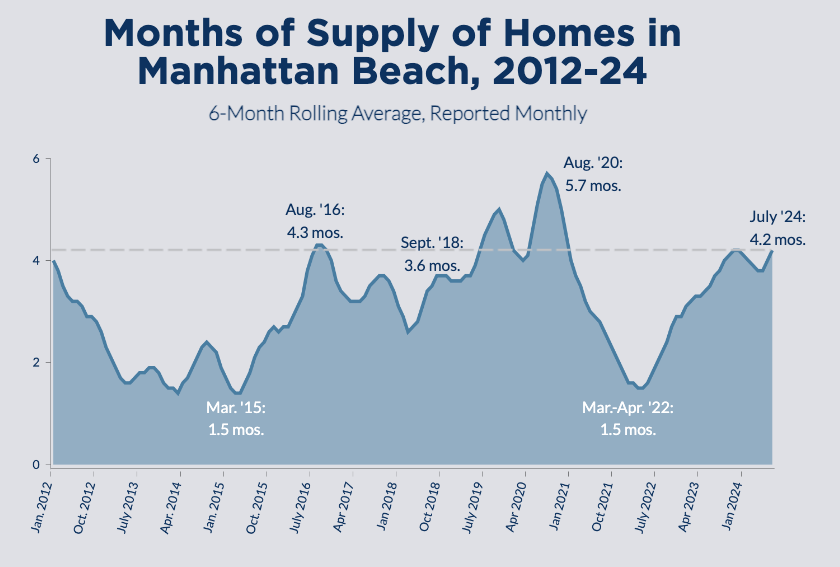
Here we are looking at about 13 years' worth of data on the "months of supply" of homes in Manhattan Beach.
To refresh your memory, the measure "months of supply" takes into account the pace and number of homes going into escrow, and estimates how long it would take to sell every listing on the market. (That's what the number of months means.) The old-fashioned rule of thumb was that 6 months of supply signified a buyers' market, but it's more accepted today that 4 months of supply can mean a buyers' market, in light of how the internet has sped the home search process.
With months of supply hitting 4.2 months at the end of July this year, you see one signal of a potential buyers' market.
This figure was rarely exceeded in prior years, except during the heat of covid, and a little bit in the sluggish market of late 2019.
We'll concede something here. Our data today – higher inventory & higher "months of supply" – points to a market that may be becoming more favorable to buyers, and therefore may signal softer prices as well. And yet, on the front lines, we're starting to see something different: More sales activity than we've felt out there in some months.
Both reports can be true. The "months of supply" figure, for instance, represents the 6 months from February-July, and it does seem to accurately capture a relatively slower-than-usual Spring market.
But that doesn't tell you what's happening today, and doesn't predict the future.
Anyone can bet on the next steps in this market. We're thinking Q4, and even September to December, could become one of the busiest periods we've seen since the market locked up in May 2022, after rates spiked.
Watch this space...
------------------------------------------------------
Here's the rest of our local real estate market update report for the period ending 8/15/24:
> 88 active listings as of 8/15/24 (+2 from 7/31/24)
> 67 SFRs (+1)
> 21 THs (+1)
See the Inventory list as of 8/15/24 here, or see the MB Dashboard for up-to-the-minute data.
Active listings by region of Manhattan Beach in this report:
> Tree Section: 14 actives (flat)
> Sand Section: 43 actives (+2)
> Hill Section: 8 actives (flat)
> East MB: 23 actives (flat)
We're also providing a report on closed sales by region of MB.
Sales data, including PPSF for all properties, are organized by sub-region of Manhattan Beach.
Here's a link to the spreadsheet: "MB Pending/Sold as of 8/15/24".
Please see our blog disclaimer.
Listings presented above are supplied via the MLS and are brokered by a variety of agents and firms, not Dave Fratello or Edge Real Estate Agency, unless so stated with the listing. Images and links to properties above lead to a full MLS display of information, including home details, lot size, all photos, and listing broker and agent information and contact information.

