For quite a while, we've openly complained here on MBC about the limited inventory in the Manhattan Beach real estate market.
After something of a market shock in Spring 2022, a chronic shortage of available homes became the norm.
That meant buyers were less inspired to act, and sales statistics of all kinds suffered.
This year, however, we're seeing a rebound, with substantially more homes for sale here in the Spring and Summer months.
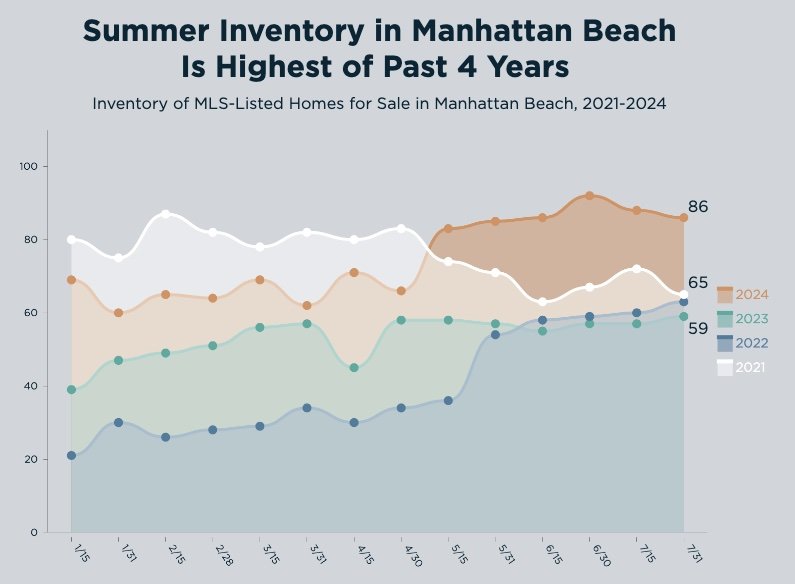
With 86 homes on the market as of July 31, we had 27 more listings than at the same time last year.
This was a similar jump over inventory in 2021 and 2022.
Indeed, the orange/brown shaded area at the top right of the chart shows a sustained increase in homes on offer since April this year.
Would it surprise you to know that both the numbers of pending sales, and closed sales, are running higher this year than last, given the greater inventory? OK, no big surprise.
But numbers like this are all relative.
We're going to add the previous 5 years to the chart, 2016-2020, inclusive.
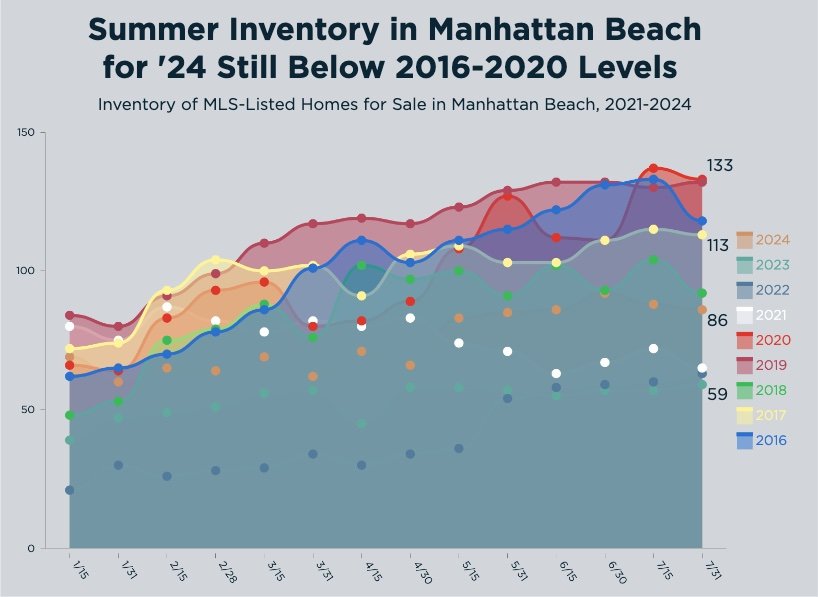
OK, that is not nearly as pretty of a chart, we're first to admit.
And we had to expand the scale to a max of 150 listings just to account all the new data added in.
But what do we see?
Every year from 2016-2020 had higher inventory than this year, by quite a margin in most cases. For instance, there were 46-47 more listings on the market at this time of year in 2019 and 2020.
All of those years ended with considerably more sales than we're on pace for here in 2024. The median home price dropped only once, by 2% at the end of calendar year 2019.
So, while this year's boost in inventory is welcome for buyers wishing for more options, the jump above recent years is not so much as to call a glut – not even slightly. If anything, we're just beginning to move back toward normal inventory levels.
------------------------------------------------------
Here's the rest of our local real estate market update report for the period ending 7/31/24:
> 86 active listings as of 7/31/24 (-2 from 7/15/24)
> 66 SFRs (+3)
> 20 THs (-5)
See the Inventory list as of 7/31/24 here, or see the MB Dashboard for up-to-the-minute data.
Active listings by region of Manhattan Beach in this report:
> Tree Section: 14 actives (flat)
> Sand Section: 41 actives (-1)
> Hill Section: 8 actives (-1)
> East MB: 23 actives (flat)
We're also providing a report on closed sales by region of MB.
Sales data, including PPSF for all properties, are organized by sub-region of Manhattan Beach.
Here's a link to the spreadsheet: "MB Pending/Sold as of 7/31/24".
Please see our blog disclaimer.
Listings presented above are supplied via the MLS and are brokered by a variety of agents and firms, not Dave Fratello or Edge Real Estate Agency, unless so stated with the listing. Images and links to properties above lead to a full MLS display of information, including home details, lot size, all photos, and listing broker and agent information and contact information.

